|
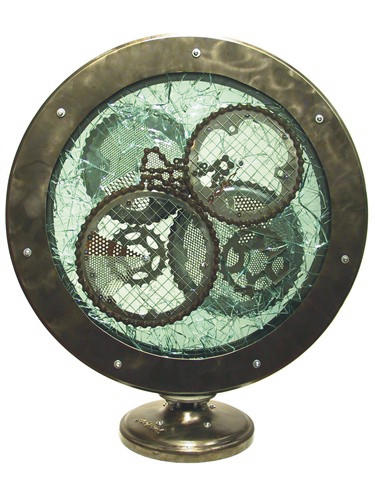
Fertilizer and Pesticide
Study 1961-2003
20" diameter x 3" (freestanding)
found metal and glass
Brent Bukowski 2005
Pat Forsyth photo |
Fertilizer and Pesticide
Study 1961
|
Pesticide Trade (Value $1,000's) |
|
COUNTRIES |
1961 |
2003 |
|
Developed Imports |
96,527 |
8,821,735 |
|
Developed Exports |
243,287 |
10,176,275 |
|
Developing Imports |
170,740 |
4,098,868 |
|
Developing Exports |
24,497 |
2,397,381 |
|
Difference |
24,959,208 |
|
|
% change from 1961 to 2003 |
+4765% |
|
 |
 |
|
Fertilizer Consumption (tonnes) |
|
REGION |
1961 |
2002 |
|
Africa |
716,141 |
4,278,401 |
|
Asia |
3,809,371 |
77,115,906 |
|
Europe |
13,955,459 |
21,872,407 |
|
Latin America |
979,127 |
13,229,831 |
|
North America |
8,048,099 |
21,912,204 |
|
Oceania |
964,047 |
3,162,281 |
|
Difference |
113,098,786 |
|
|
% change from 1961 to
2002 |
+497% |
|
SOURCE:
Food and Agriculture Organization of the United
Nations (FAO). 2004. FAOSTAT on-line statistical service.
Rome: FAO. |
|
